How to easily insert images, tables, charts, and more into Google Docs
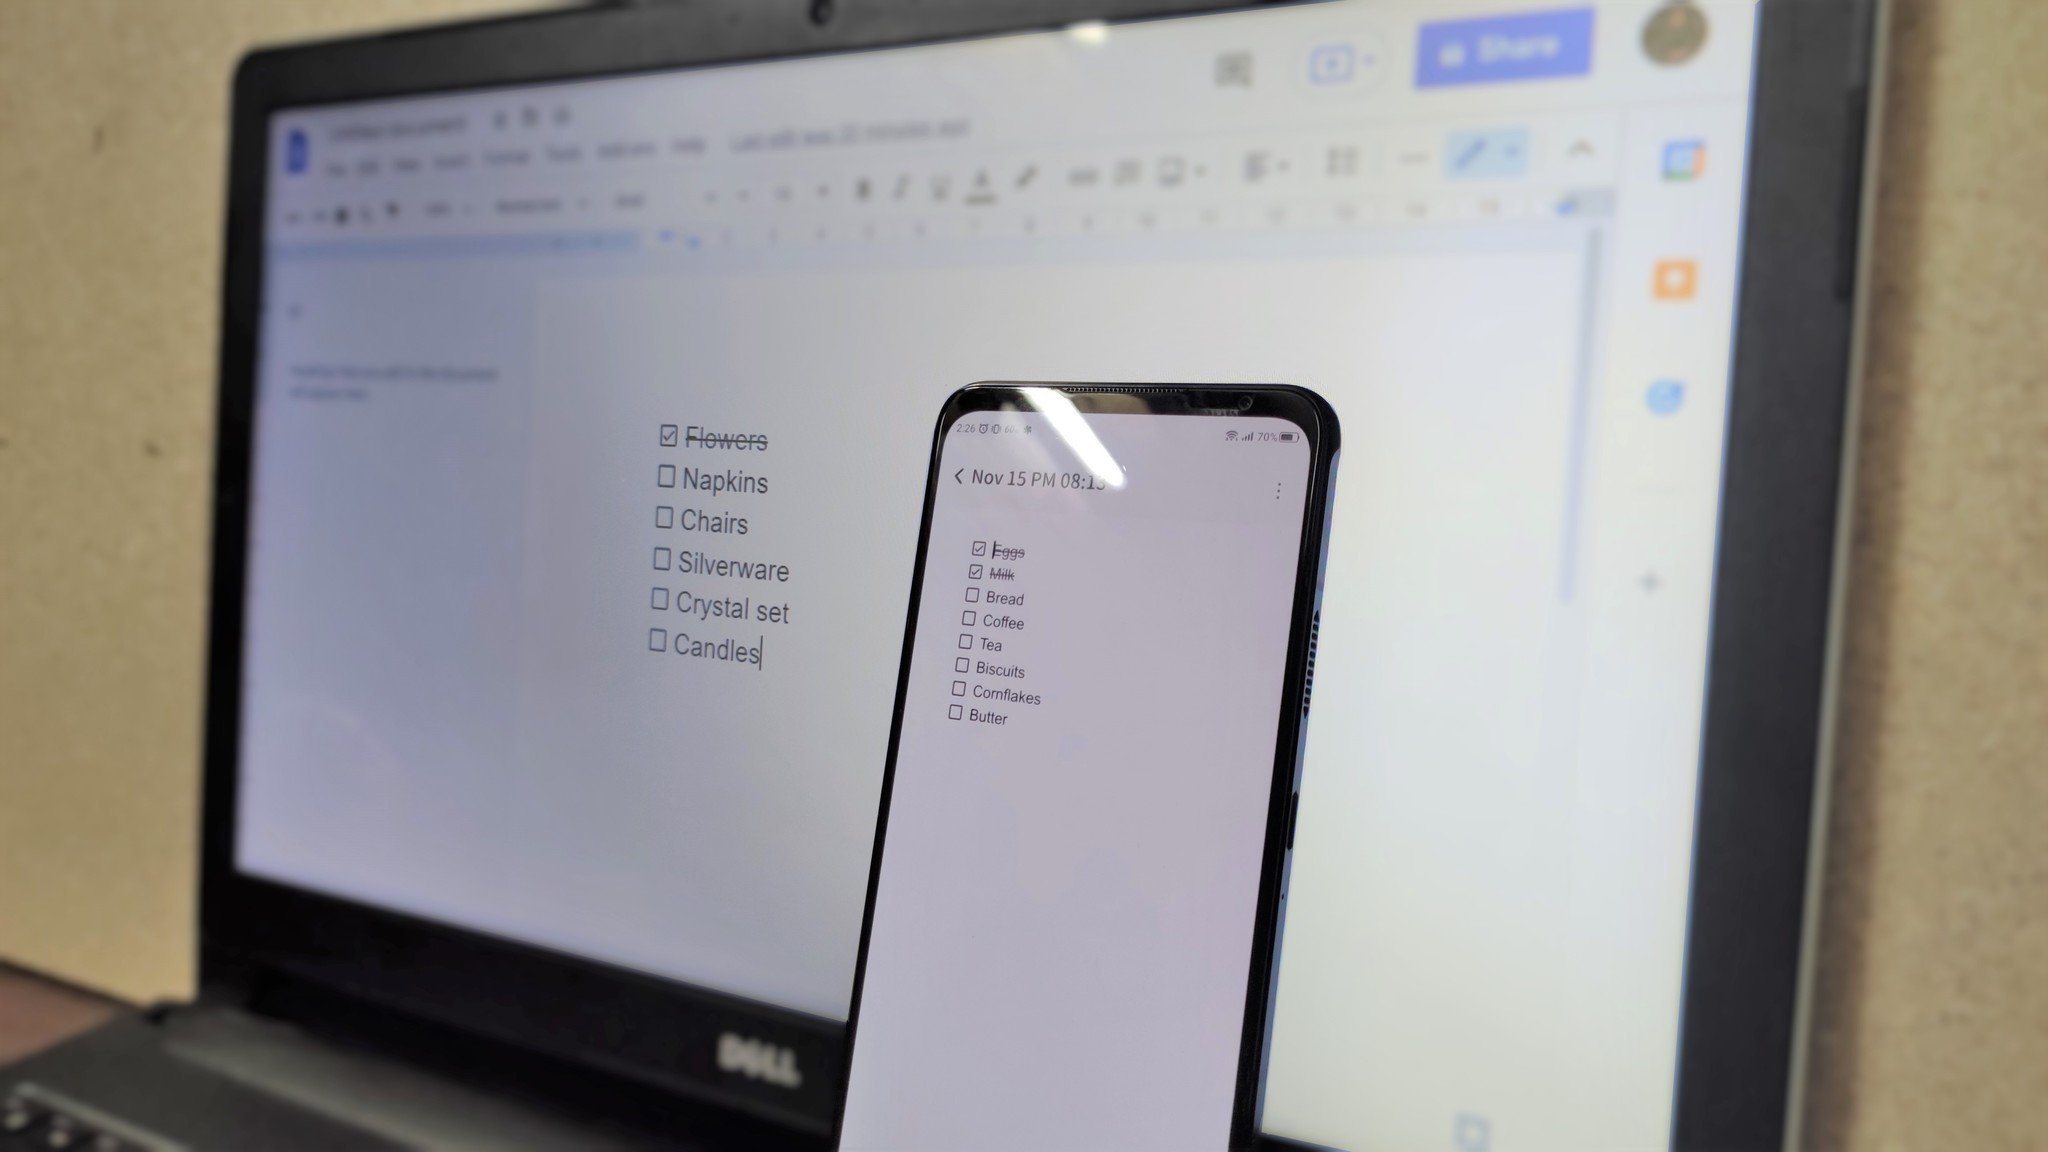
Among the dozens of apps and services that Google offers, Google Docs is easily one of the most powerful. The online word processing program is used by millions of users around the world for its collaborative workflow and easy access. And thanks to the recent addition of a universal @-menu, it has become even easier to insert images, tables, charts, and more into Google Docs. In fact, you don't even need to move your mouse to do so!
How to quickly and easily insert images, tables, charts, and more into Google Docs
Regardless of what you want to insert, you start off by hitting the @ key in any document. This brings up a menu with a list of recommended items that can be added to the document.
The items that can be inserted into your document include images, tables, drawings, charts, different types of lists, titles and headings, footnotes, and much more. You can even add other documents stored in your Google Drive, meeting blocks from Google Calendar, and directly mention other users by their email addresses.
How to insert images in Google Docs
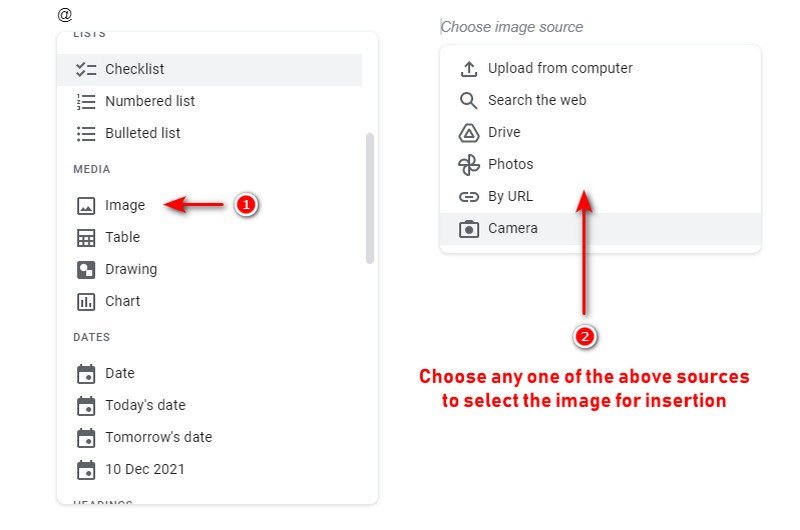
- Choose the Image option from the @-menu,
- Select the source (e.g. Google Drive, Google Photos, your computer) of the image to be uploaded from the sub-menu.
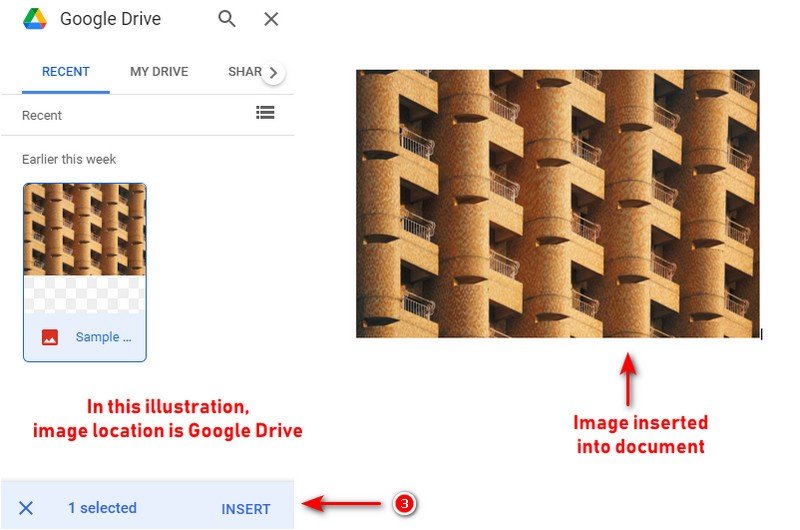
- Once you navigate to the image's location, all you have to do is select it and click the Insert option.
- It should now be inserted into your document.
How to insert tables in Google Docs
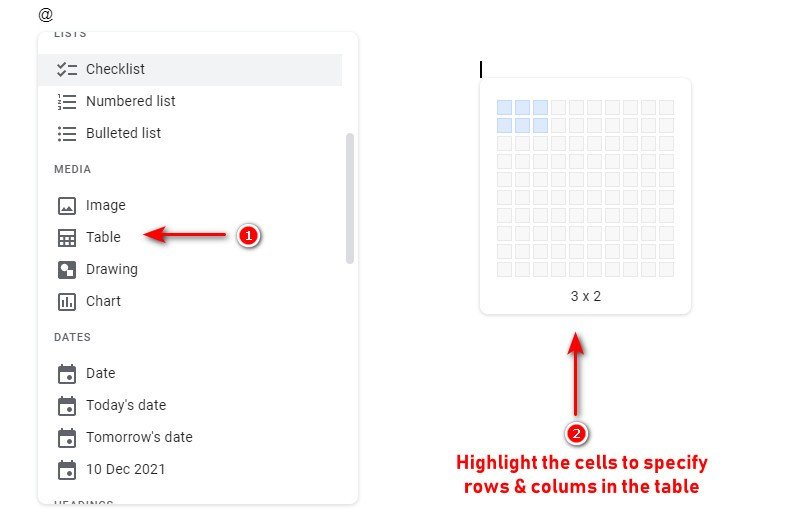
- Choose the Table option from the @-menu.
- You'll be presented with a pop-out grid of cells.
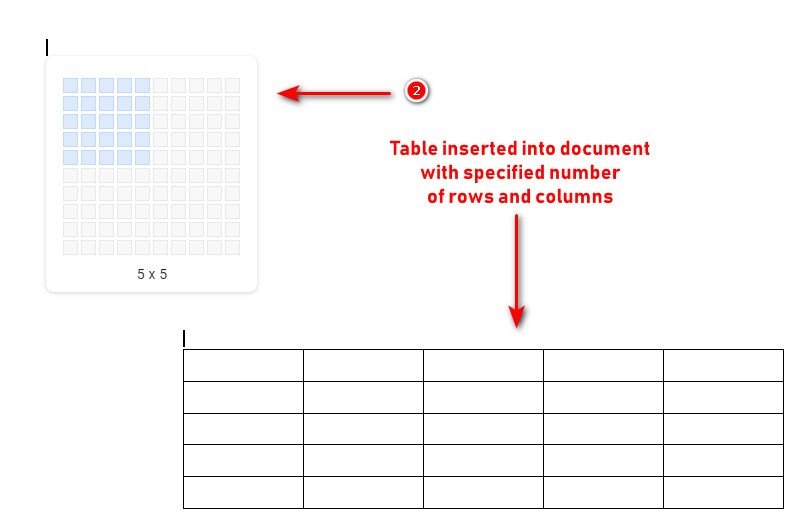
- A table can have a maximum of 10 rows and colums each.
- Once the size is specified, the table will be inserted into your document.
How to insert charts in Google Docs
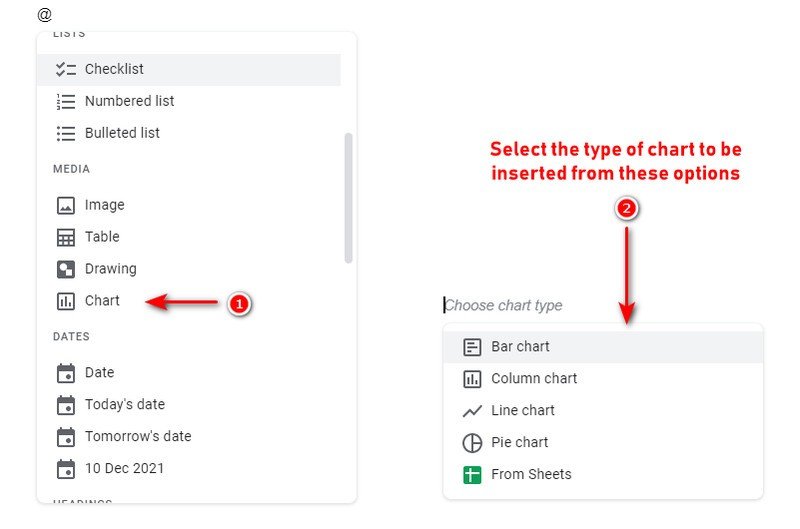
- Choose the Chart option from the @-menu.
- Select the type of chart (e.g. Bar, Line) to be added.
- You can use this option to view/edit the chart's data values in Google Sheets.
Supercharge your Google Docs workflow
Whether you want to insert a footnote, other documents stored in Google Drive, or anything else, the steps remain virtually the same.
It's also worth mentioning that many of these items are interactive. For example, if you hover over a user's email address, you can view or edit their access options for the document. Similarly, adding a meeting block lets you add notes, view/edit the list of attendees, and more.
As awesome as these Google Docs features are, having one of the best Chromebooks can go a long way in making your experience even more productive. Our overall pick goes to Lenovo's Chromebook Flex 5i, which offers everything from great battery life to a 360-degree hinge at a very affordable price.

Feature-packed yet affordable
If you want a value-for-money Chromebook, look no further than Lenovo's Chromebook Flex 5i. Having (up to) an 11th-generation Core i5 CPU, it features solid battery life, a wide range of I/O ports, and a lot more, at a very attractive price.
Get the latest news from Android Central, your trusted companion in the world of Android

When Rajat got his first Personal Computer—a Pentium III machine with 128MB of RAM and a 56kbps dial-up modem—back in 2001, he had little idea it would mark the beginning of a lifelong love affair with gadgets. That fascination, combined with a penchant for writing and editing, ultimately led to him becoming a technology journalist. Some of his other interests include Photography, Hand Lettering, and Digital Typography. Rajat is also somewhat obsessed with wrist-worn timepieces and appreciates a Casio just as much as a Jaeger-LeCoultre.
