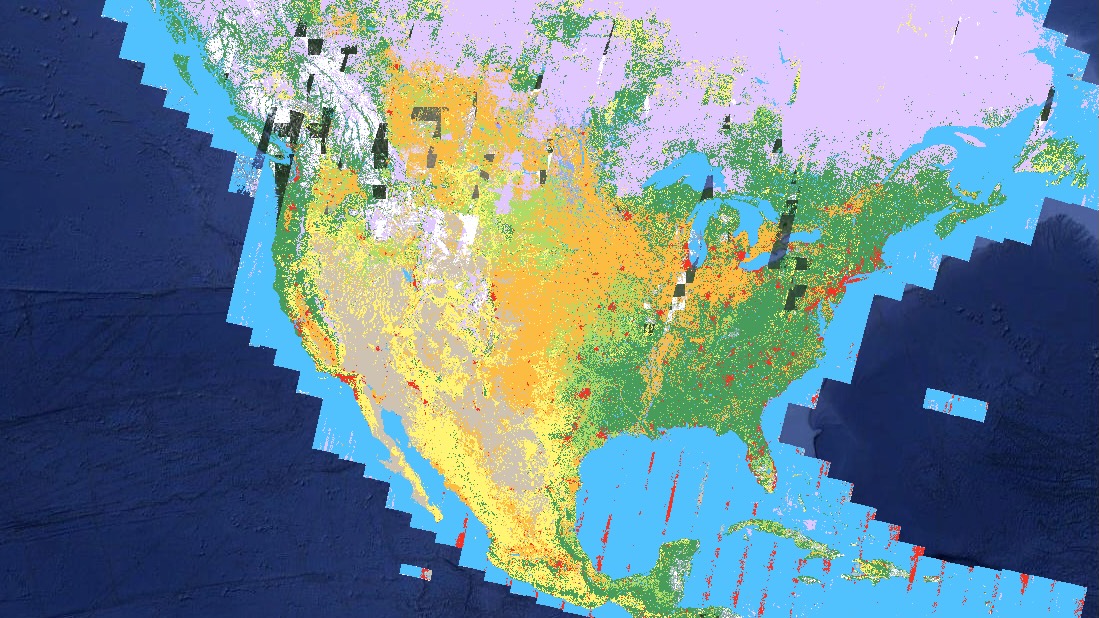
Google Earth meets Captain Planet with new Dynamic World environmental map
See the real-time effects of natural disasters and urbanization on the world (or where you live).

Get the latest news from Android Central, your trusted companion in the world of Android
You are now subscribed
Your newsletter sign-up was successful
What you need to know
- Google used AI and Google Earth satellite data to produce real-time results of current and past land cover.
- This tool will allow researchers to see the impact of urbanization, deforestation, climate change, and natural disasters like wildfires.
- This tool will help governments and nonprofits track negative environmental changes over time, down to the 10-meter level.
Google Earth has always reflected the current state of the world. Now, Google and the World Resources Institute (WRI) are using this satellite data to actually track Earth's changes over time, in order to study environmental trends over time.
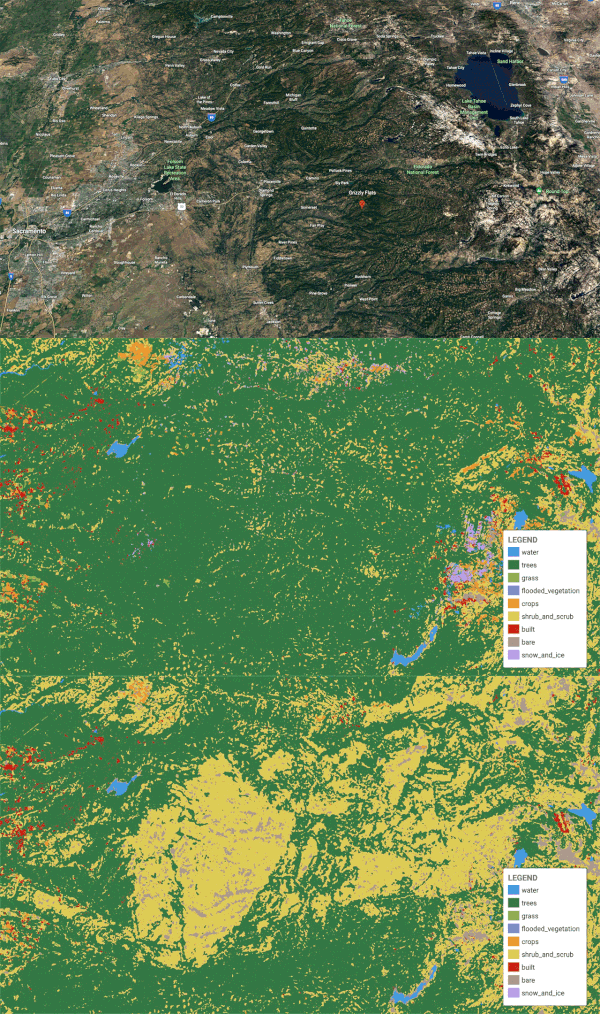
Dynamic World is a publicly available satellite tool that shows how much of the world's land cover is taken up by 9 different categories of land: water, trees, grass, crops, shrubs, flooded vegetation, built-up area (aka urban area), bare ground, and snow/ice. You can check real-time info on current land cover or show how the land has changed in a given area over the course of weeks, months, or years.

Dynamic World creates thousands of images of the world per day that can determine land cover down to 10-meter resolution, meaning every display pixel covers 10m of space. Apparently this kind of land cover data "can take months or years to produce," whereas Dynamic World takes just a few days, dating back to June 2015.
Governments and scientists can use this data to track progress towards meeting the Paris Agreement, the site suggests, or check on the impact of natural disasters on the local environment. Dynamic World shows a few timelapse examples like the aftermath of a wildfire and volcanic eruption, as well as more benign shifts like seasonal changes to an ecosystem.
We've previously seen some pretty amazing Google Earth timelapses like the video above, that show shocking changes to the planet over the past four decades. But this is the first time Google Earth is being used in a more methodical, scientific manner.
You can check out Dynamic World for yourself right now. Type in your ZIP code or city to get a close-up look at where you live. Turn down the opacity to figure out what, exactly, you're looking at, then change the dates and click Before/After to get a sliding look at how the land around you has changed in recent years.
Get the latest news from Android Central, your trusted companion in the world of Android

Michael is Android Central's resident expert on wearables and fitness. Before joining Android Central, he freelanced for years at Techradar, Wareable, Windows Central, and Digital Trends. Channeling his love of running, he established himself as an expert on fitness watches, testing and reviewing models from Garmin, Fitbit, Samsung, Apple, COROS, Polar, Amazfit, Suunto, and more.
